Customize lattice drawings
Qumin’s lattice drawing algorithm is highly customizable. The CLI offers a few options, but drawing lattices straight in Python is easy and allows more advanced customization.
For this how-to, we will use the following patterns computed on the ParaKar dataset for Livvi Karelian noun inflection:
pip install paralex
paralex get 13736170 -o parakar
qumin action=patterns data=parakar/parakar.package.json  sample_lexemes=200 cells="['ill.sg', 'gen.sg', 'part.sg', 'part.pl', 'gen.pl']" seed=0 hydra.run.dir=parakar-patterns
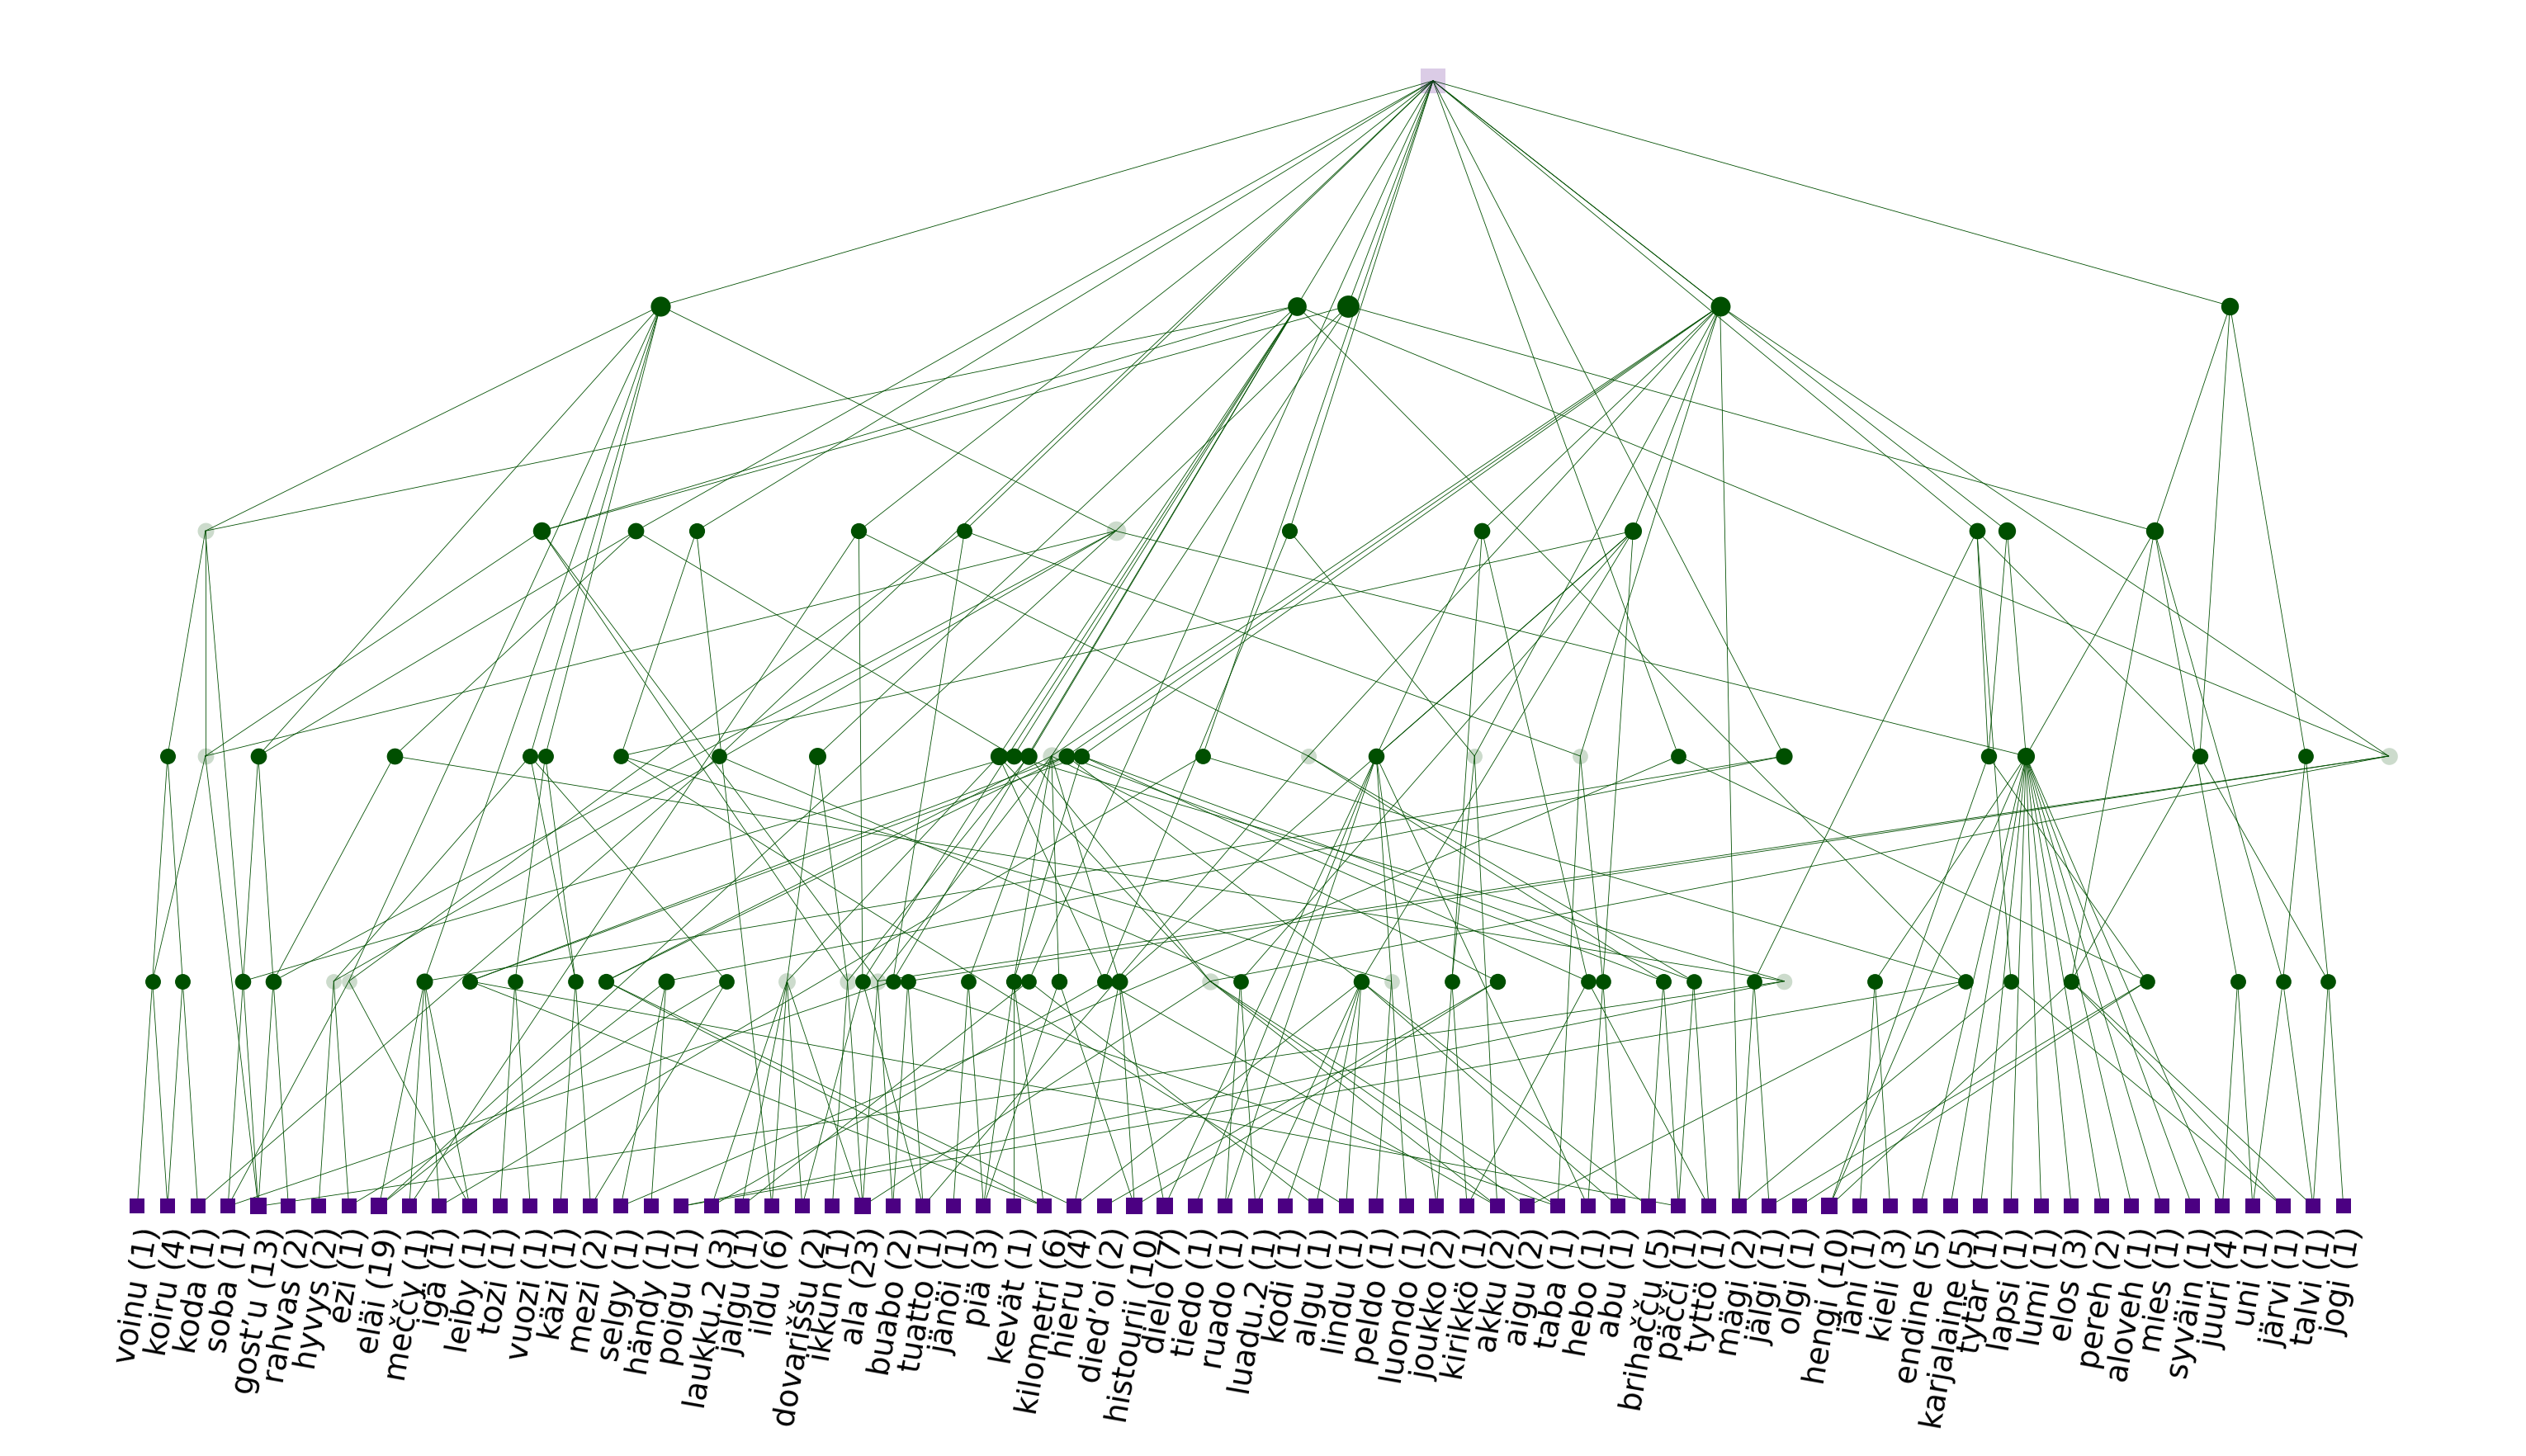
We now draw the default lattice and export it to .png, .pdf and .html:
qumin action=lattice patterns=parakar-patterns/metadata.json data=parakar/parakar.package.json hydra.run.dir=parakar-lattice lattice.export.png=True lattice.export.html=True lattice.export.pdf=True
The output is the following:
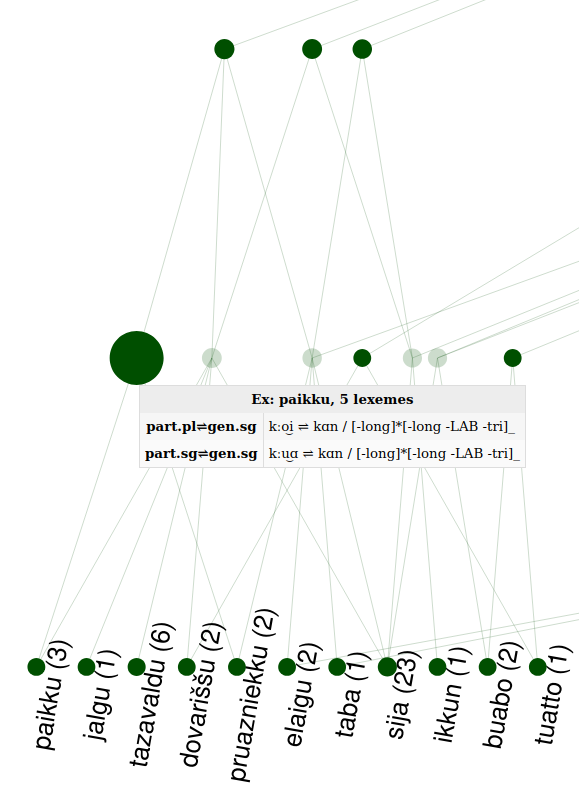
Additionally, you get a lattice.html file, which you can explore in more detail using a browser. You can select nodes to hide them, or hover on a node to see its properties (lexemes & patterns), as shown below:
CLI options
Command line options only control the shape of the lattice.
lattice.display.layout: allows you to use different engines to compute the position of the nodes when the lattice is drawn. Often used values arequmin(to use Qumin’s internal algorithm) ordot(which requirespygraphviz. Other options are possible (see the documentation for a full list)lattice.display.horizontal,lattice.display.topdown: these options command the orientation of the lattice. Default is top to down.
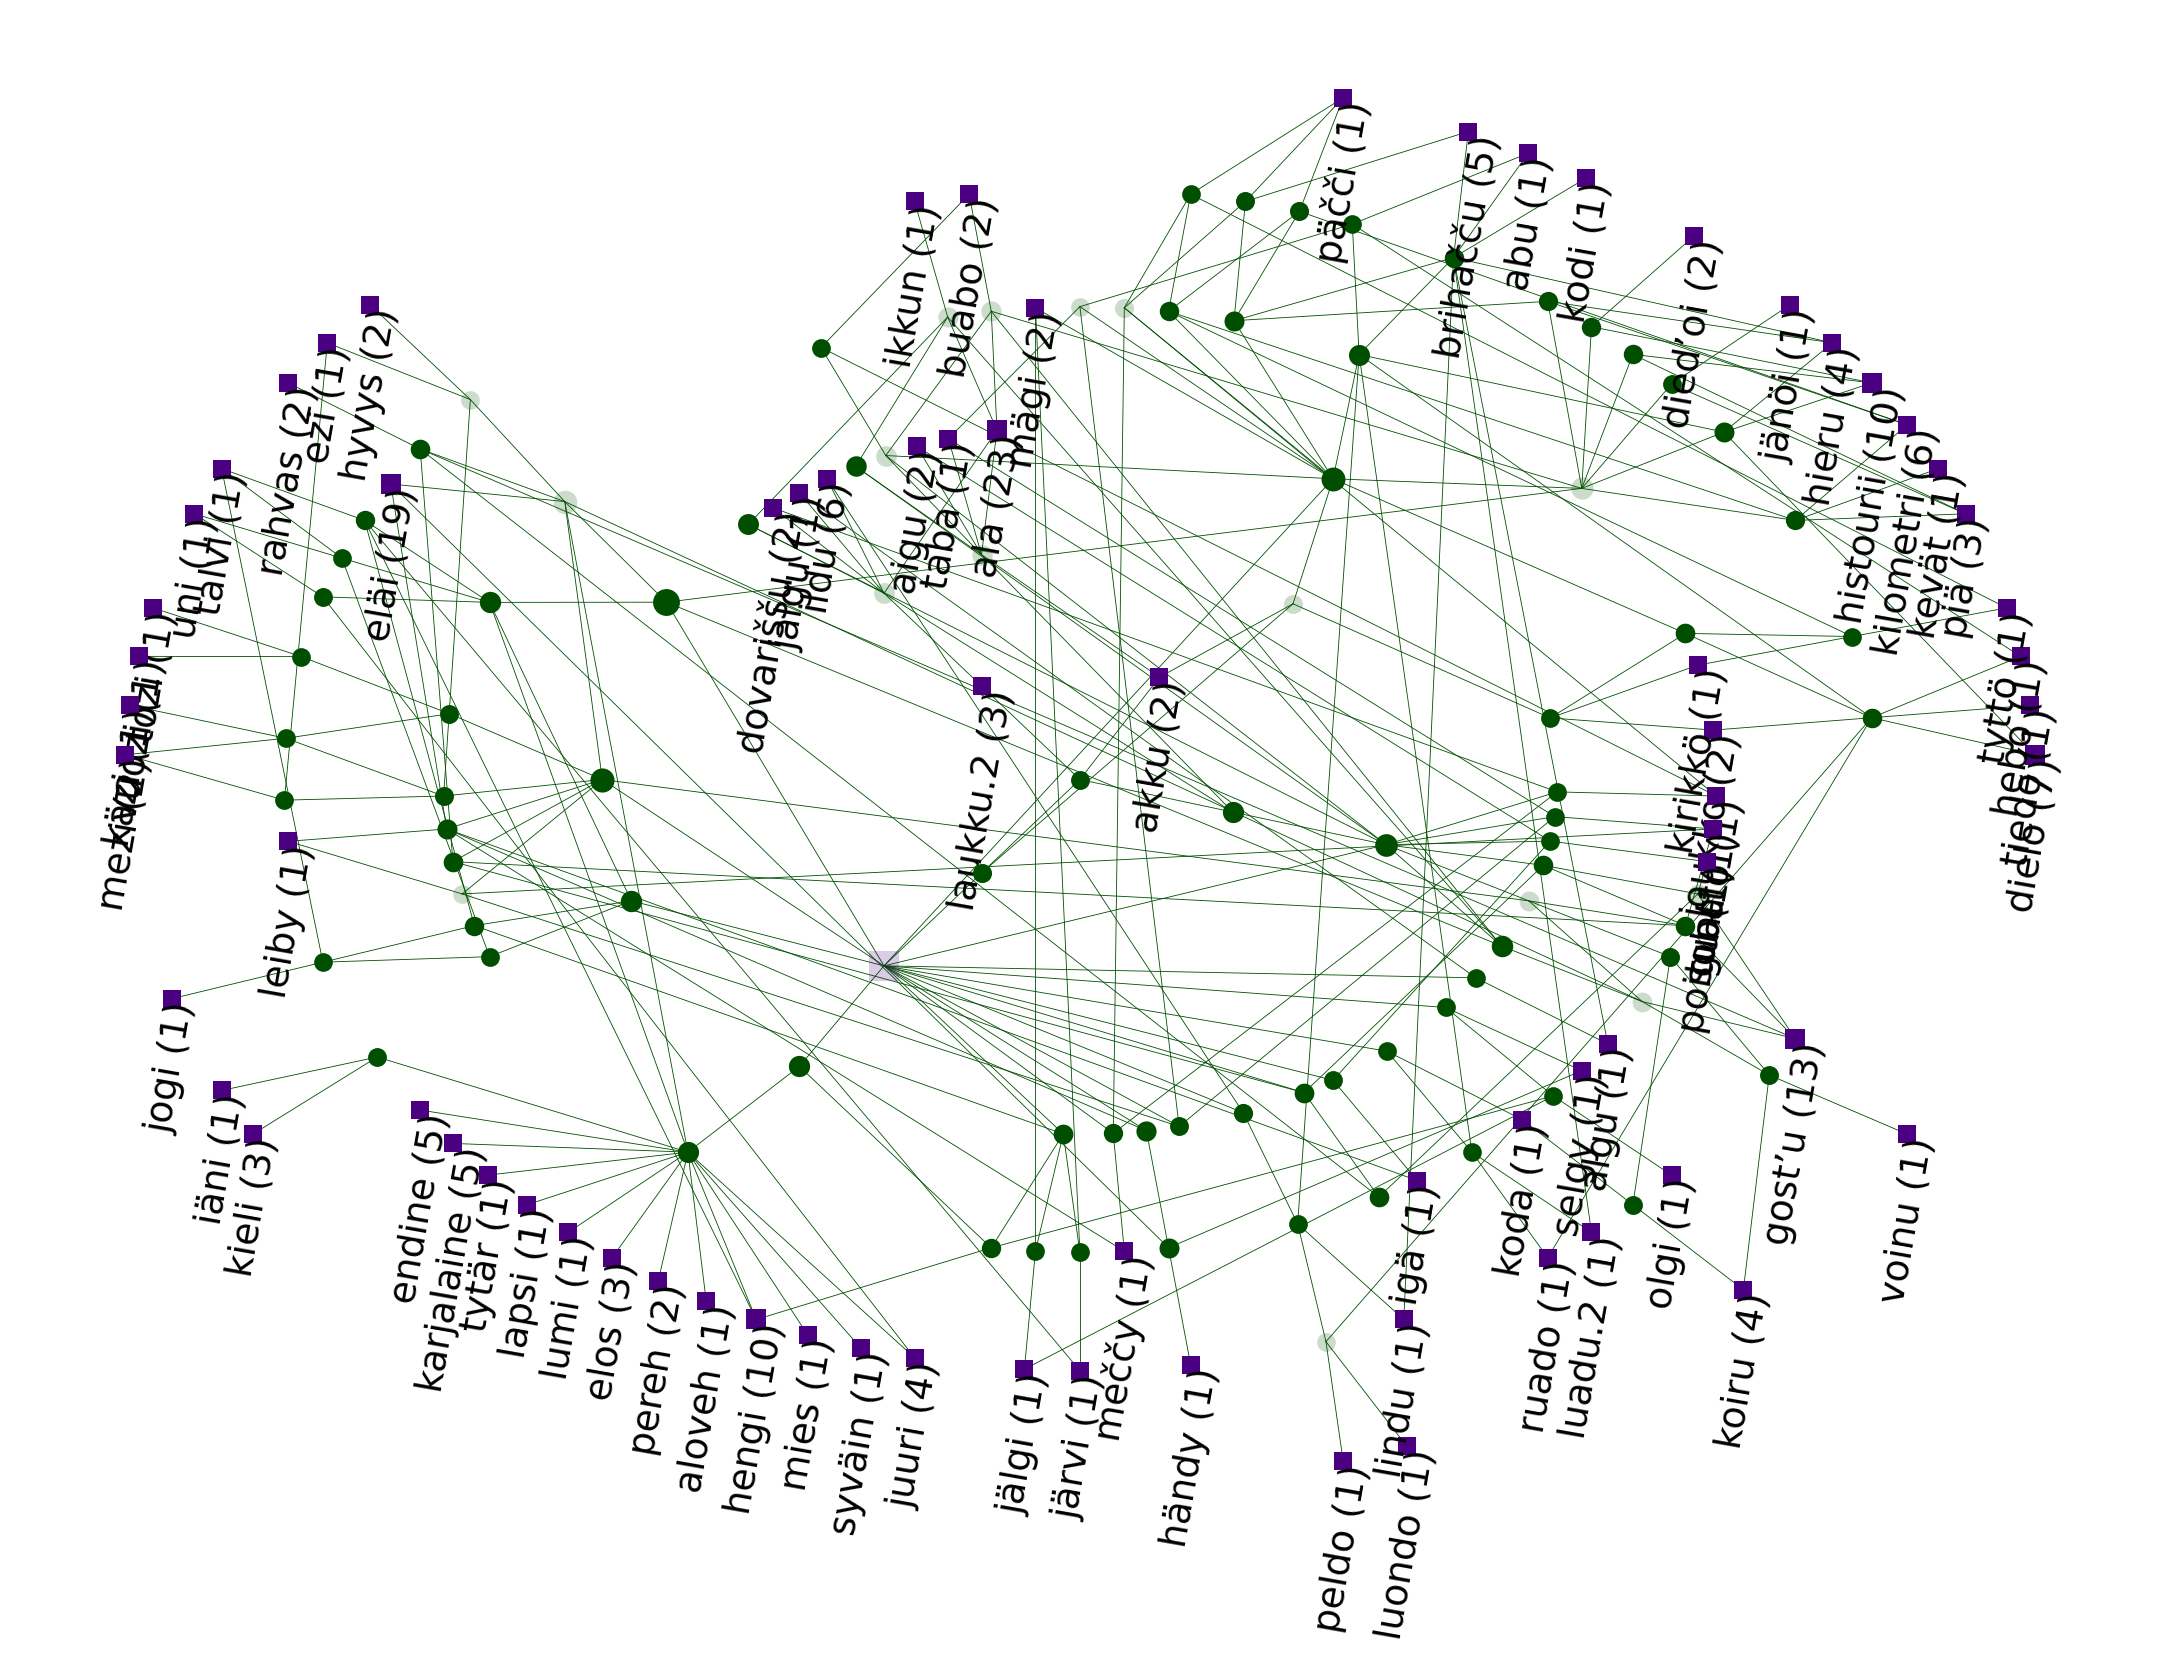
qumin action=lattice patterns=parakar-patterns/metadata.json data=parakar/parakar.package.json hydra.run.dir=parakar-lattice lattice.export.png=True lattice.display.layout=radial
The output is the following:
Lattices in python
Using Qumin’s python API in scripts, you can unlock additional customization possibilities, changing the patterns that are exposed, the color, size, labels of nodes, the tooltips displayed in HTML, and much more.
Get the lattice
This small snippet of code will load the patterns and the paradigms. For more details, read the How-to on scripts.
import qumin.utils.tools as tools

paradigms, patterns = tools.get_patterns("parakar/parakar.package.json",
                                         "parakar-patterns/metadata.json")
Next step is computing lattices from patterns. For now, we will use the dedicated export method:
lattice = patterns.to_lattice() # pass aoc=True for AOC lattices
On large lattices, this step can be very long. Once the lattice is computed, use to_figure() (for PDF, PNG, etc) or .to_html() (for HTML) to produce the same figures as with the CLI.
lattice.to_figure(filename="lattice.png", layout="qumin", figsize=(5, 3))
lattice.to_html(filename="lattice.html", layout="qumin", figsize=(5, 3))
figsize allows you to control the size of the figure, in inches. Other useful exports are:
lattice.nodes.to_networkx() # Get a networkx graph object
lattice.context.tofile("path.cxt", frmt="cxt") # Write a .CXT file of the lattice.
All methods are documented in qumin.lattice.lattice.ICLattice.
Customize the lattice (basic)
Both .to_figure() and .to_html() take a styler= keyword argument, which accepts any instance of the LatticeStyler class (which subclasses NodeStyler). This class is initialized with the lattice and its methods are called to get the properties of each node and edge (label, color, size).
For instance, when Qumín draws a node, it needs to now the size, shape and color of the node and thus calls:
styler.get_marker_properties(currentnode)
If no styler is passed, then Qumín will use styler=LatticeStyler(). Instead, you can instantiate a styler object with the defaults you’re interested in. For instance:
from qumin.lattice.stylers import LatticeStyler
mystyler = LatticeStyler(min_markersize=70,
max_markersize=200,
colors=["r", "orange"],
markers=["s", 's'],
horizontal=False,
topdown=True)
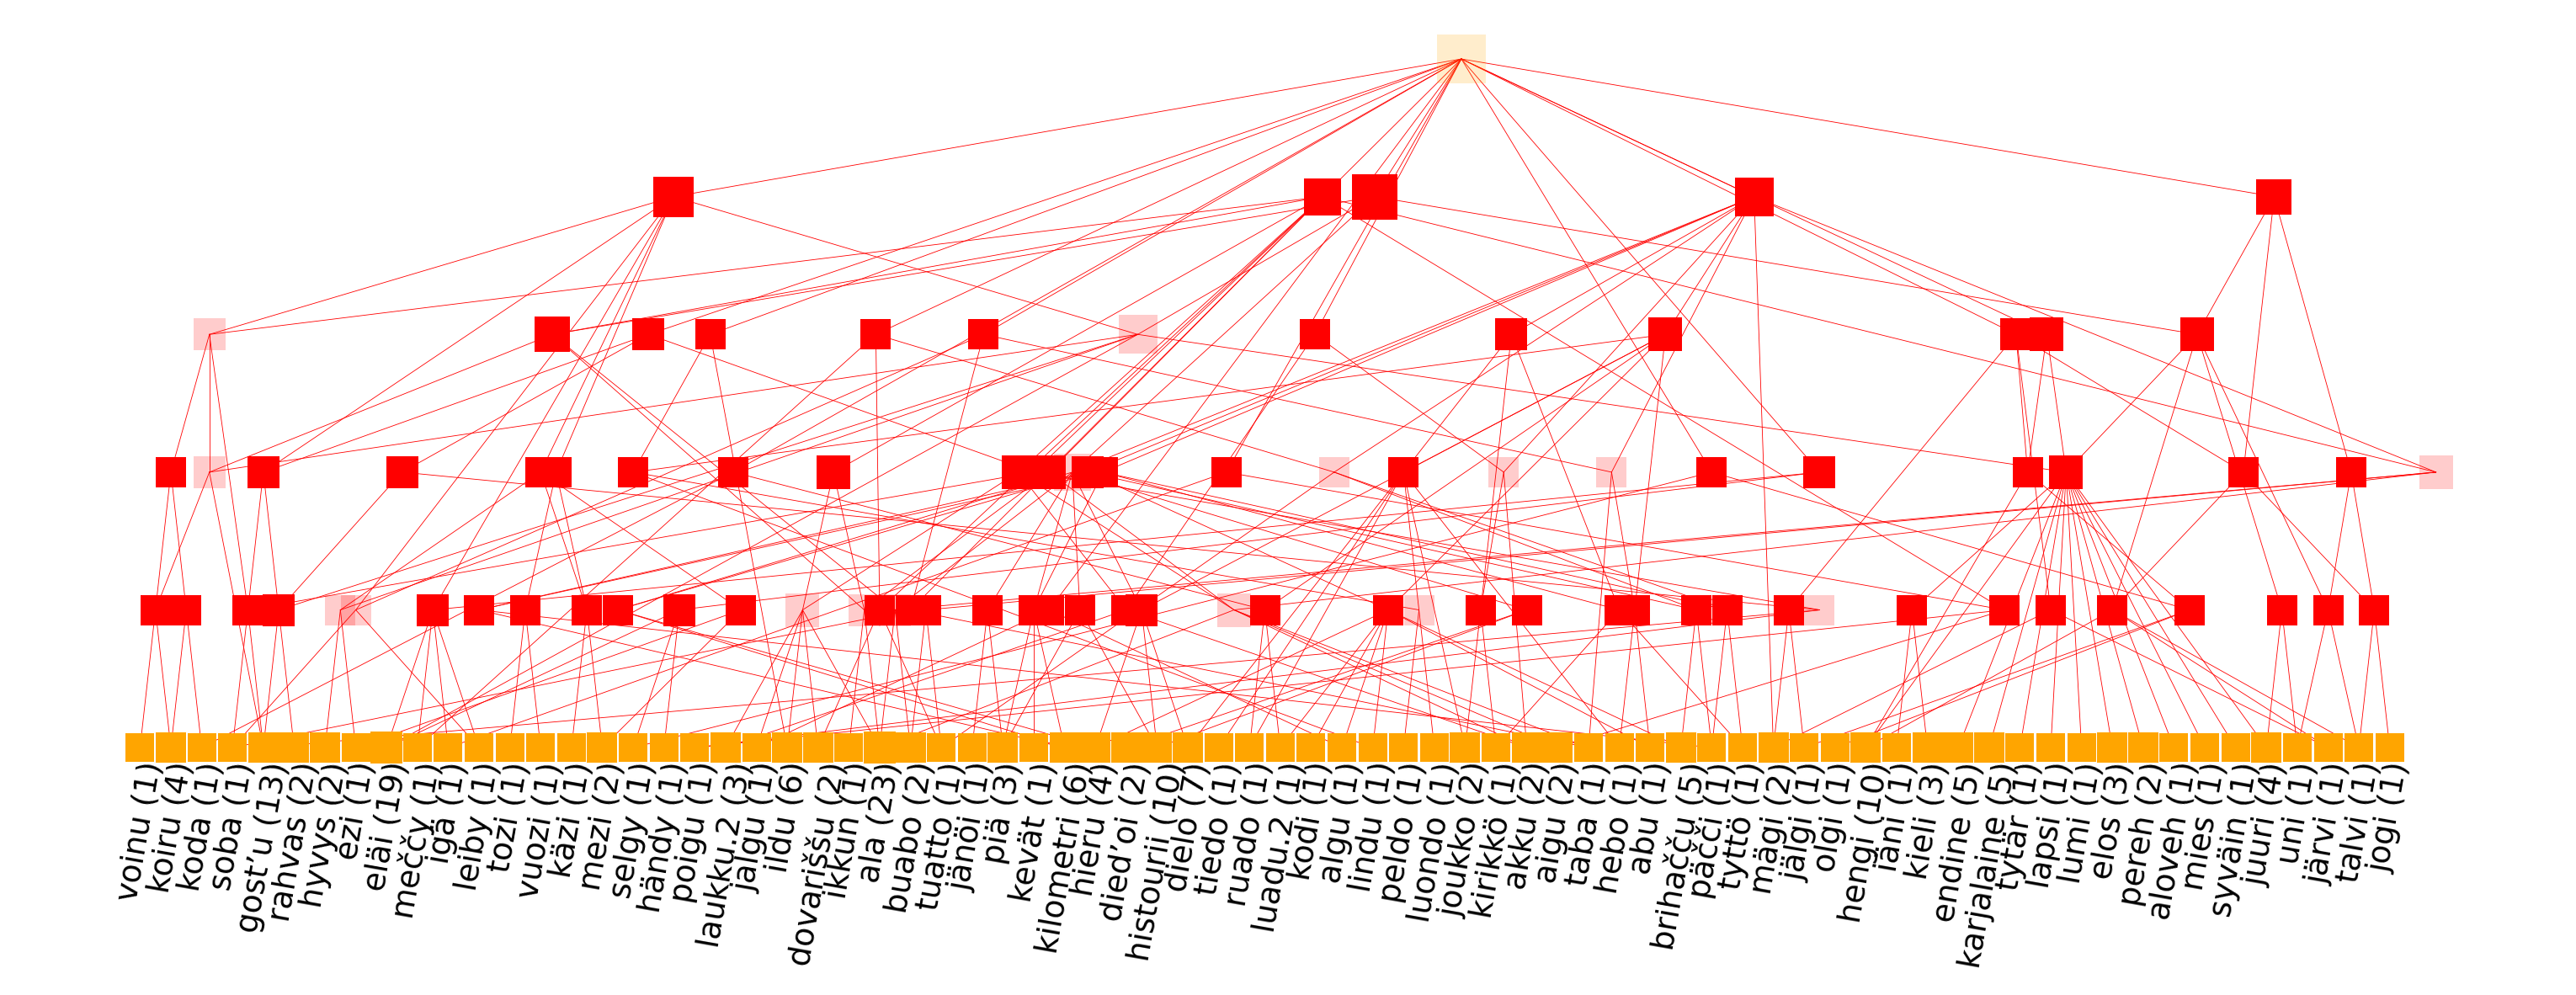
lattice.to_figure(filename="lattice.png", layout="qumin", styler=mystyler, figsize=(10, 3))
This produces a red lattice, with large square nodes:
Another useful argument is label_kws={"fontsize": 4}, to control the font. The documentation of NodeStyler and LatticeStyler lists all arguments that can be passed at initialization.
Warning
The library that exports the lattice to HTML (mpld3) does not recognize all styling options. Most often, however, the HTML export is very similar to the PDF/PNG.
Customize the lattice (advanced)
The styler argument accepts any object that implements the expected methods. If you subclass LatticeStyler and overwrite these methods, You can provide more elaborate recipes to style nodes and edges depending on their properties. Imagine for instance, that you want to put a different color on all nodes that define more than 10 lexemes. You can do that in the following way:
class CustomStyler(LatticeStyler):

    def get_node_color(self, node):
        """
        Arguments:
            node (qumin.clustering.node.Node): A lattice Node to draw.

        Returns:
            iterable: The colors to use for a given node.
        """
        if node.attributes["size"] > 10:
            return (self.colors[0],)
        else:
            return (self.colors[1],)

    def get_edge_color(self, node, child):
        return self.get_node_color(node)
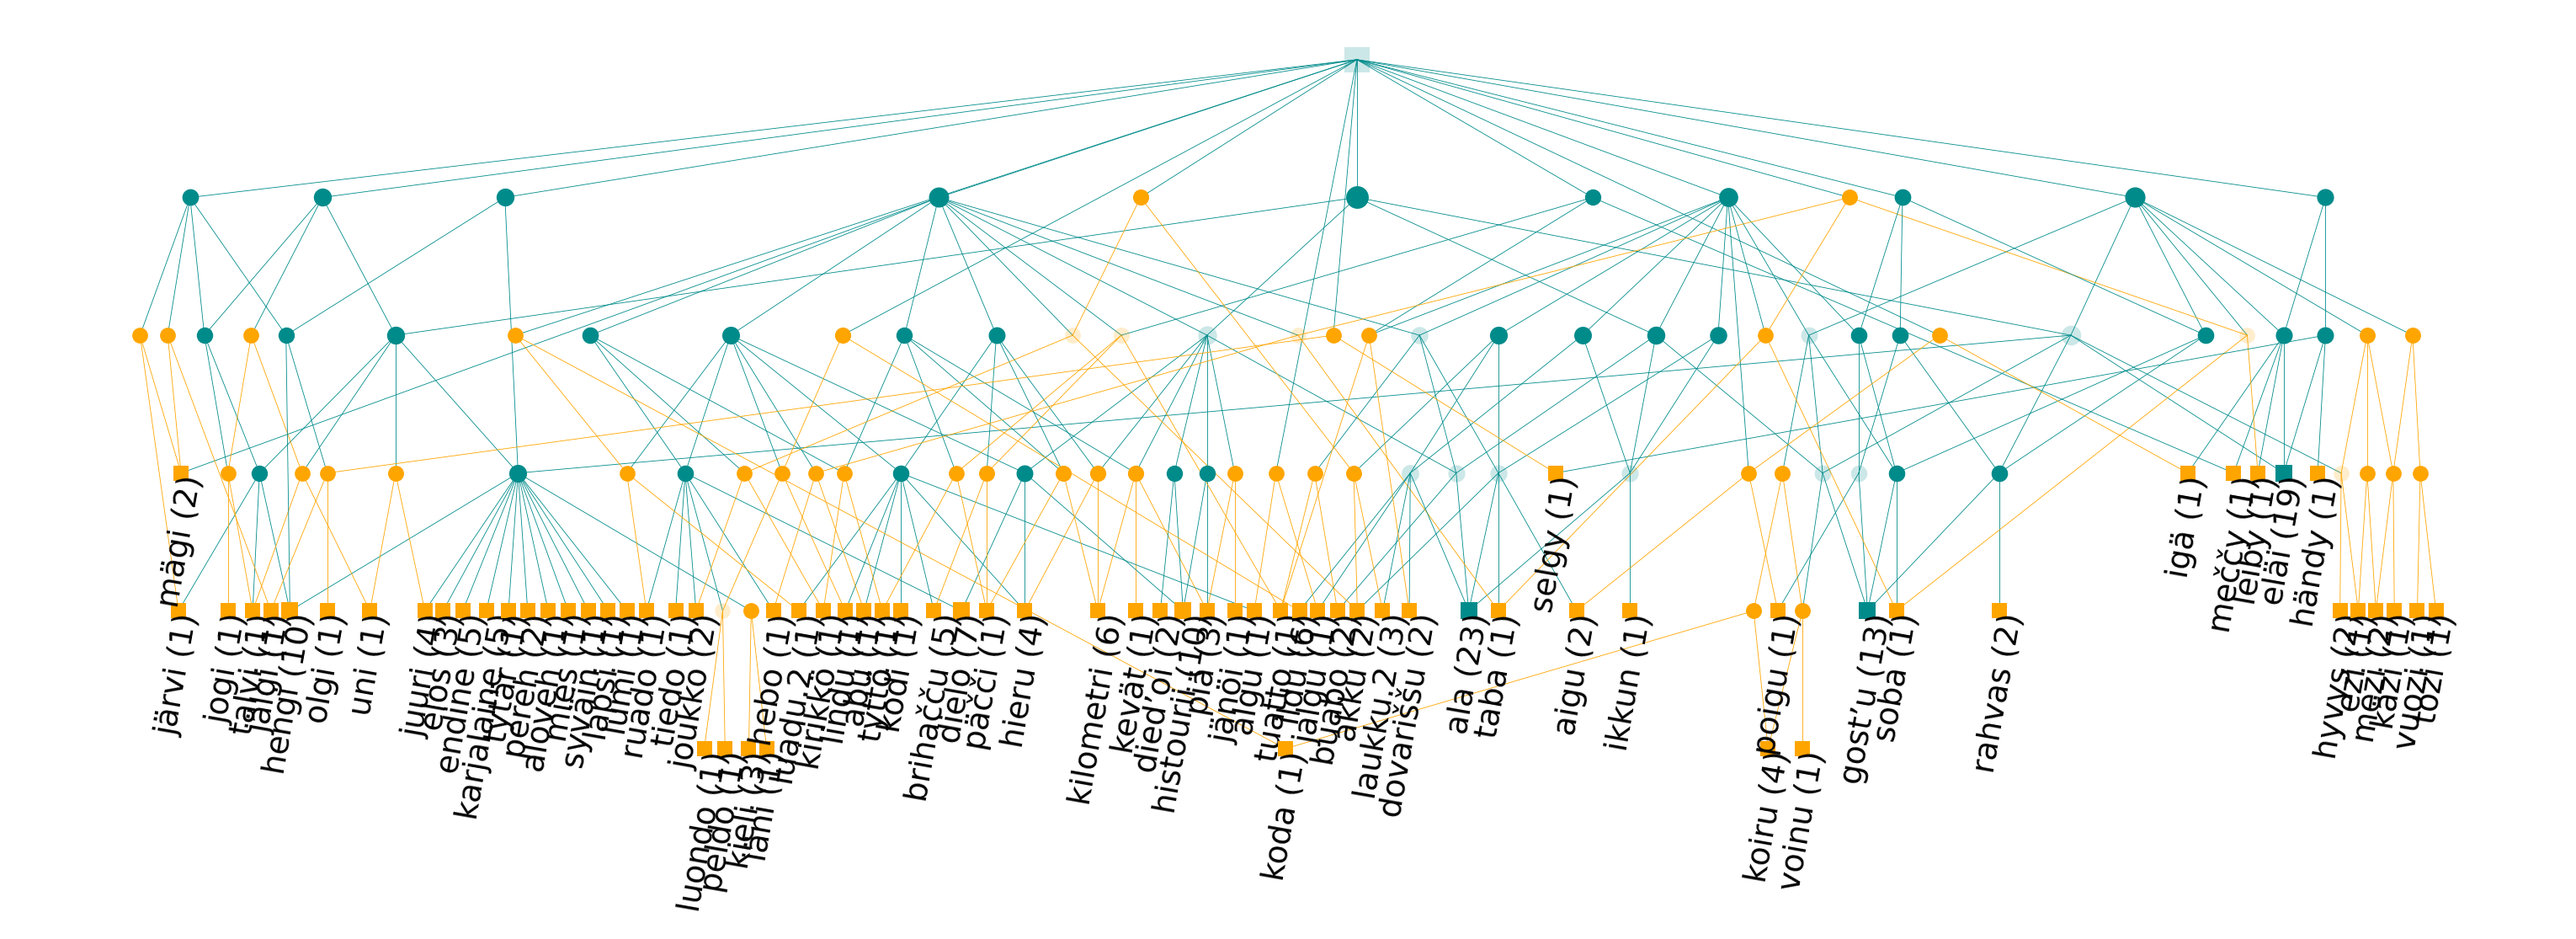
We can now use it as an ordinary styler:
customstyler = CustomStyler(colors=['darkcyan', 'orange'])
lattice.to_figure(filename="lattice-custom.png", layout="dot", styler=customstyler, figsize=(10, 3))
The best way to understand how to write custom methods is to explore the source code of existing classes, accessible through the API documentation.